One of my hobbies is to write (and sometimes re-write) graphics engines. I do this because I love the challenge of writing not only fast code but scalable code and also because I like visual stuff. This time I decide to write one in JavaScript using WebGL and as soon as I have a workable set of API’s I decide to write an simple vortex animation to see how well my new shinny new engine will perform.
I run this demo using Chrome and to my surprise, I got 9 frames per seconds (FPS), that speed almost broke my spirit. But, out of curiosity I tried the demo in Firefox.62 and guess what? I got a solid 60 FPS, cool!, now my moral was at level again. Now I wanted a third browser just to make sure and I tested in Edge where I got a solid speed of 60 FPS. The good thing is that I just need to optimise for one browser, so I decided to take a look.
Microsoft Edge

Chrome

For that animation I create the total of 1600 particles and I try to update each particle with different speed and angle to get a vortex like effect, after that, I clear the screen and paint all the particles on the screen in a time range below the 33 millisecond (ms), otherwise is going to look slow. The code was looking something like this:
    particles.forEach(particle => {
      //update particles

    })

    particles.forEach(particle => {
      //render the particles
    })
I take a quick look at what at this loops and I got the impression that the problem has to do with the utilisation of forEach instead of using a classic for from C. I would sound silly but here was my rationale (or foolish assumption) about that decision, My mind was telling me that for each iteration a memory scope was being created and that was messing with the speed of my animation. With that story, I edited my code.
  for(let i=0; i<particles.length; i++) {
    let particle = particles[i]
    // update...
  }


  for(let i=0; i<particles.length; i++) {
    let particle = particles[i]
    // render...
  }

  //....
Now the code looks more verbose and less elegant but more C like and was giving me the impression that maybe should be faster. But I run the code again and I got 10 FPS, where are my other 50 frames ?. Now the code is not only slow but now I added a new problem of code ugliness.
Solving The Mystery
Ironically Chrome has one of the best tools (in my opinion) to instrument JavaScript applications and after that humbling experience, I decided I maybe should start using it.
Chrome profiler up and running:

My first surprise is to see how much the profiler has improved, I’m able to see the correlation between the frames, time and instructions executed. After watching that I discover how much I wasted my time.
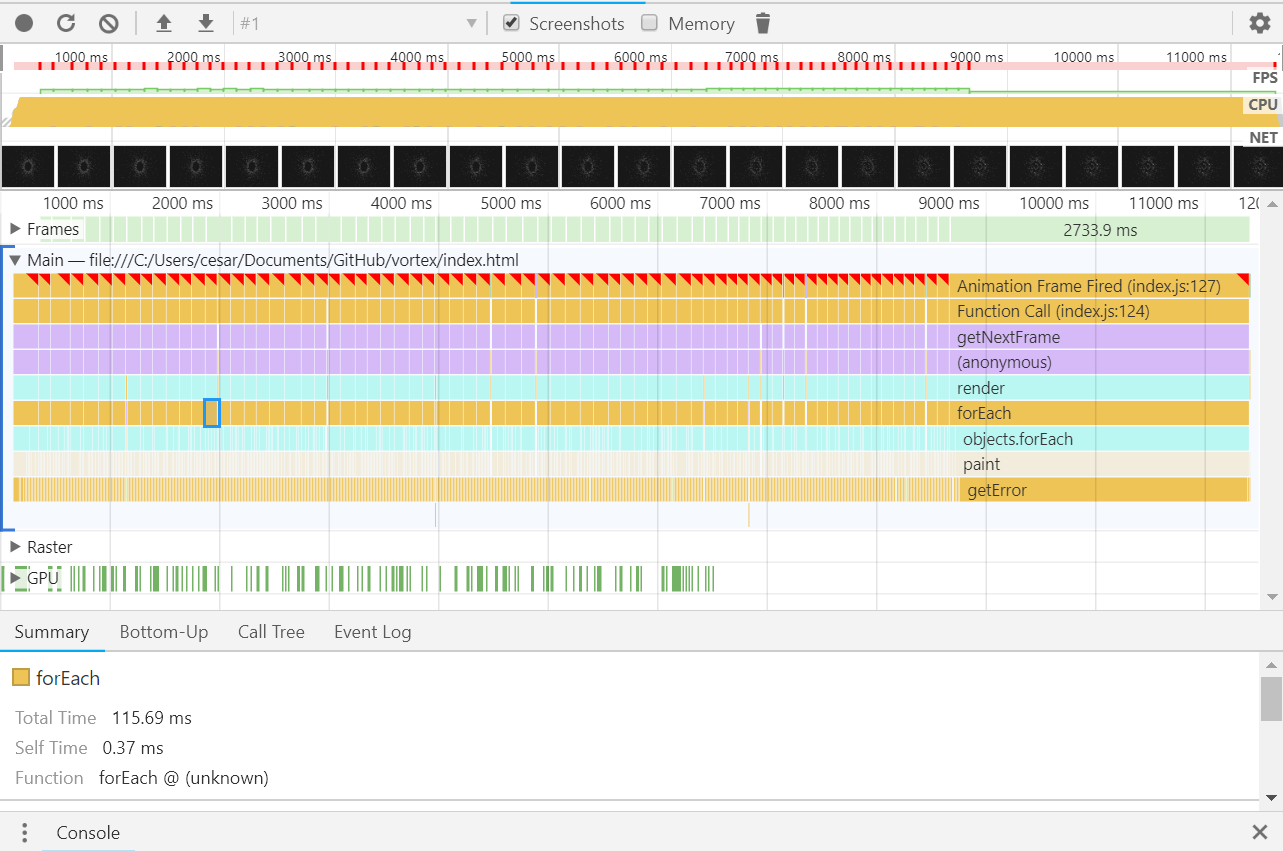
Before looking this graph just keep in mind that, to perceive an animation as fluid the program need to generate a new frame every 33ms. This meant that to hunt the bottleneck, I just need to look for functions that are beyond that threshold. The profiler has facilitated this task by painting in yellow the spots that are lagging the most. To look for a more detailed view I used the Call Tree section.
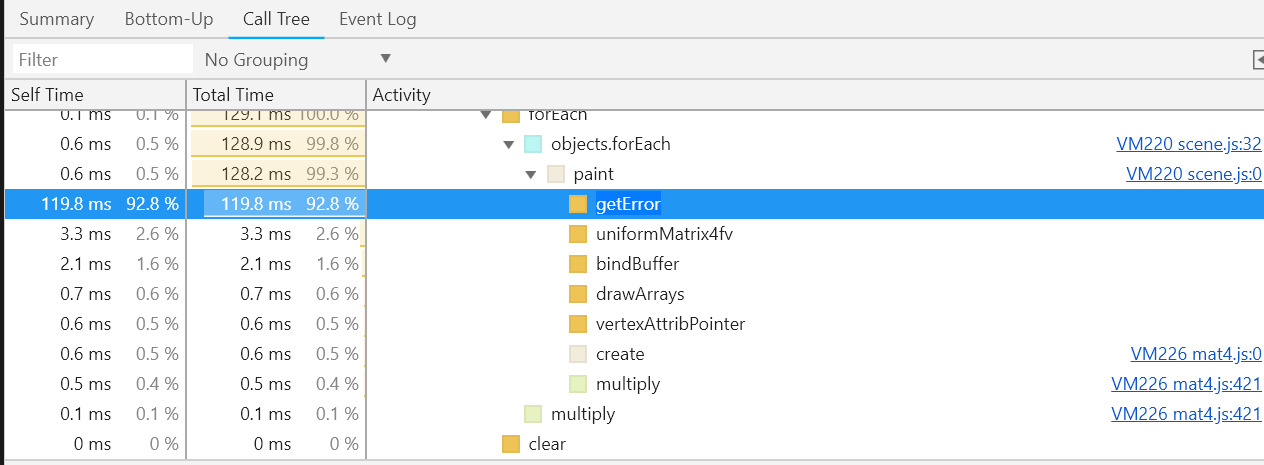
The performance problem was calling gl.getError() inside the paint function, in Chrome.
paint(object) {
  /*
     bindBuffer... 3.3ms
  */
  gl.getError() // 119.8ms
}
That method gl.getError() logs to the console any exception that happens in that blackbox which is WebGL and for some reason calling this function is very slow (≈119ms) in Chrome, even when I run my demo with the inspector closed. Other browsers are smarter and are deactivating that mechanism if the inspector is closed. But again that my guess again.
I rollback those ugly changes and run the code again, the demo now runs at 60 FPS across all browsers (Android included). The main problem here was assuming I can solve that problem without measuring and doing that is just wasting time and energy. As Michael Abrash put it his awesome book, Graphic Programming Black Book.
Assume nothing… If you don’t measure performance, you’re just guessing, and if you’re guessing, you’re not very likely to write top-notch code.
If you want to take a look at the source code, the project is published in Github.